Preprocessing#
import numpy as np
import matplotlib.pyplot as plt
import glob


import CASBI.preprocessing as preprocessing
/opt/anaconda/conda/envs/torch/lib/python3.10/site-packages/pandas/core/arrays/masked.py:60: UserWarning: Pandas requires version '1.3.6' or newer of 'bottleneck' (version '1.3.5' currently installed).
  from pandas.core import (
Preprocessing#
In this notebook we show how to genereate the main files needed to create the input for the inference, also known as Template Library (For more details, see the :class:CASBI.create_template_library.TemplateLibrary class.).
The main preprocessing component are:
Files (.npz): numpy array that are obtain directly from the simulations using the
pynbodylibrary.Preprocessing file (.npz): It saves aggregated information of Galaxy Mass, Number of stars, [Fe/H] and [O/Fe] in the preprocess_dir.
Dataframe (pd.Dataframe): contains the star mass, the infall time and maximum
[Fe/H]and[O\Fe]of each galaxy in the simulations. It is used for the sampling scheme.
# CREATION OF THE Files from the simulations
# it can take some time to generate the files

sim_path = glob.glob('/mnt/storage/_data/nihao/nihao_classic/g?.??e??/g?.??e??.0????')
file_path = '../../data/casbi_rewriting/new_files'
preprocessing.gen_files(sim_path=sim_path, file_path=file_path)
# CREATION OF PREPROCESSING FILE AND DATAFRAME

file_dir = '../../data/casbi_rewriting/new_files'
preprocessing_dir = '../../data/casbi_rewriting/'

preprocess_file_path = preprocessing.preprocess(file_dir=file_dir, preprocess_dir=preprocessing_dir)
print('Preprocesse file location:', preprocess_file_path)
100%|██████████| 7248/7248 [02:13<00:00, 54.25it/s]
../../data/casbi_rewriting/preprocess_file.npz
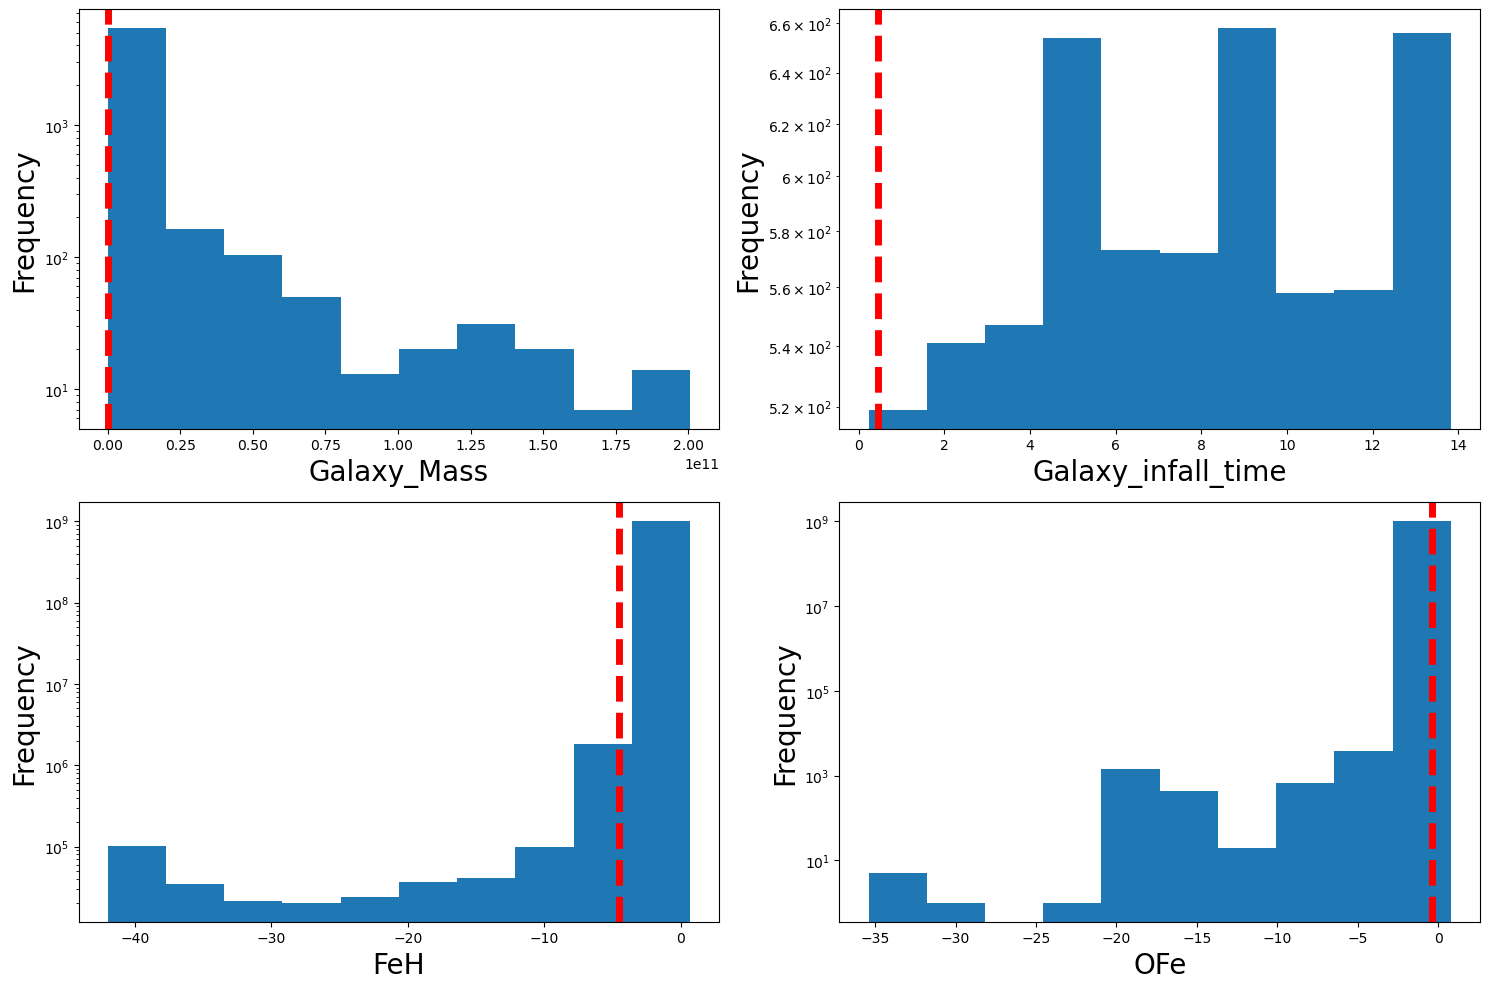
#Spot check to see that the outlier chemical outlier removal is not too aggressive

# Load the .npz file
preprocessing_file = np.load(preprocess_file_path, allow_pickle=True)

# Get the keys from the .npz file
keys = preprocessing_file.files

# Determine the number of rows and columns for the subplots
n_keys = len(keys)
n_cols = 2
n_rows = (n_keys + 1) // n_cols

# Create a figure with subplots
fig, axes = plt.subplots(n_rows, n_cols, figsize=(15, 10))

# Flatten the axes array for easy iteration
axes = axes.flatten()

# Plot histogram and vertical line for each key
for i, key in enumerate(keys):
    data = preprocessing_file[key]
    axes[i].hist(data)
    axes[i].set_yscale('log')
    percentile_01 = np.percentile(data, 0.1)
    axes[i].axvline(percentile_01, color='r', linestyle='dashed', linewidth=5)
    axes[i].set_xlabel(key, fontsize=20)
    axes[i].set_ylabel('Frequency', fontsize=20)

# Hide any unused subplots
for j in range(i + 1, len(axes)):
    fig.delaxes(axes[j])

# Adjust layout
plt.tight_layout()
plt.show()
file_dir = '../../data/casbi_rewriting/new_files'
preprocessing_dir = '../../data/casbi_rewriting/'

df = preprocessing.gen_dataframe(file_dir=file_dir, dataframe_path = preprocessing_dir)
df.head()
| star_mass | infall_time | Galaxy_name | max_feh | max_ofe | |
|---|---|---|---|---|---|
| 0 | 1.420102e+05 | 0.448779 | g1.05e11.00032 | -2.981872 | 0.755956 |
| 1 | 1.061463e+06 | 0.664548 | g1.05e11.00048 | -2.123312 | 0.755956 |
| 2 | 2.240866e+06 | 0.880318 | g1.05e11.00064 | -2.063627 | 0.756730 |
| 3 | 4.397970e+06 | 1.096087 | g1.05e11.00080 | -1.814505 | 0.756730 |
| 4 | 6.164643e+06 | 1.311857 | g1.05e11.00096 | -1.916148 | 0.756730 |
import os
import pandas as pd
file_path=os.path.join(file_dir, os.listdir(file_dir)[1])
properties = ['star_mass', 'infall_time', 'Galaxy_name', 'feh', 'ofe']
data = [np.load(file_path)[prop].item() for prop in properties[:3]]
#get the maximum of feh and ofe
data.append([np.load(file_path)[prop].max() for prop in properties[3:]])
properties[2:] = ['max_feh', 'max_ofe']
df_temp = pd.DataFrame(columns = properties)
df_temp.loc[0] = data
properties[3:]
['feh', 'ofe']